
How CrimeGrade™ builds crime scores a business can count on
Measuring where crime happens is hard, and turning police statistics into numbers a business can act on is harder. Most crime reports skip the hard part: they pass along the FBI's yearly counts for a whole city or county, or estimate where offenders live.
CrimeGrade™ does the hard part. It estimates crime where it happens, hexagon by hexagon, at every address in the U.S., and turns the estimates into scores a business can compare from one location to the next.
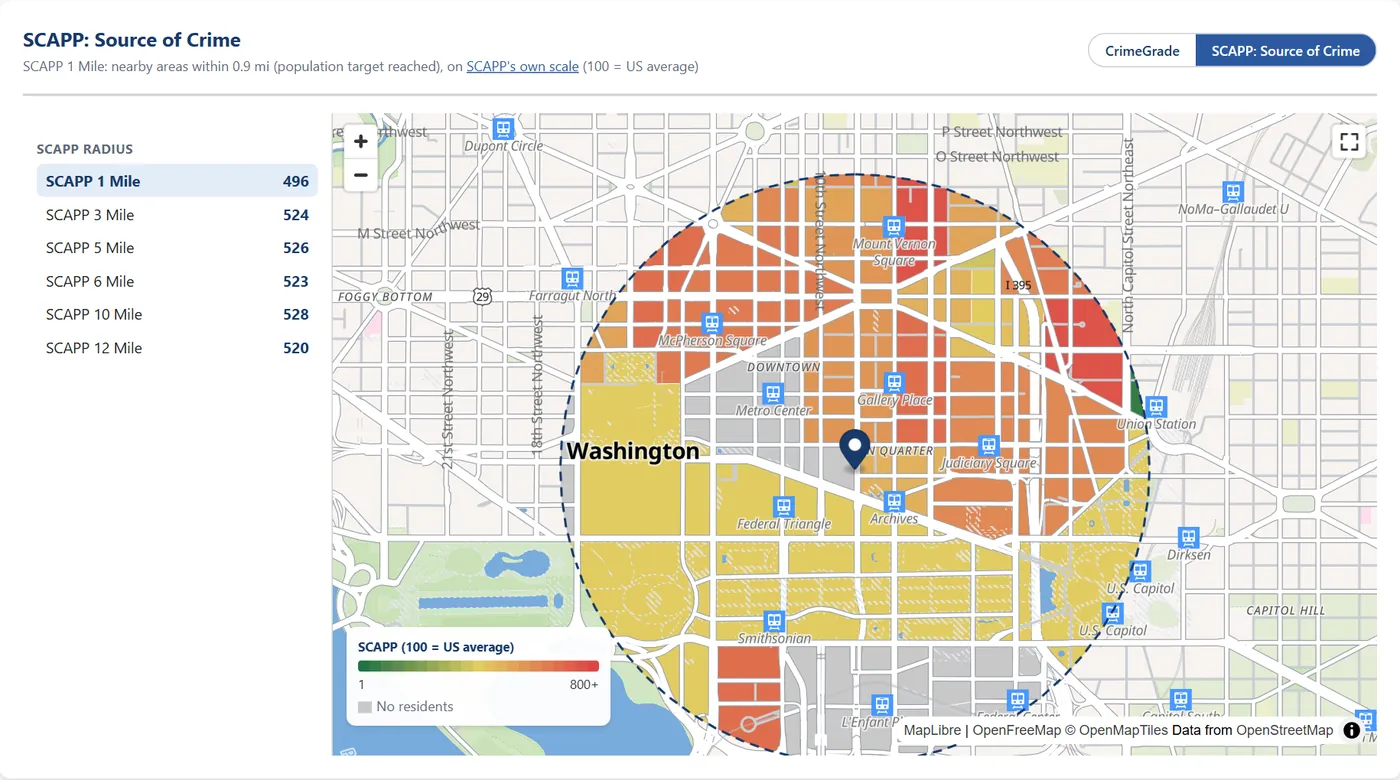
Source-of-crime reports score a location on how many people likely to commit crimes live nearby.
Each estimate starts from the conditions that predict crime at the location, such as foot traffic, parking, nearby businesses and night lighting.
Neighborhood indexes give every block in an area the same average, so a store inherits its neighborhood's number.
Crime is estimated for each hexagon of a nationwide grid, so stores a block apart get their own scores.
Dividing crime by residents makes downtowns and shopping districts, where few people live, read as the most dangerous ground in a city.
Each crime is measured against what it targets: shoplifting against retail floor area, vehicle theft against parked cars and street robbery against time spent in public.
Police filings to the FBI carry missing months, partial years, typing errors and one-month spikes.
Each department's filings are checked month by month, and failed months are corrected or set aside before any estimate is built.
About 1 in 20 Americans live where the local police department sent the FBI no crime counts for the year.
The same model estimates crime everywhere, so every location in a chain lands on one national scale.
Scores built from the conditions around each store
CrimeGrade™ estimates crime from the conditions at and around each location: how many people pass by, how many cars park nearby, which businesses surround it and how well the street is lit at night. Those conditions predict where crime happens, and a store's losses happen where crime happens.
CrimeGrade™ tested 21,607 factors from 125 data families. Each crime's model keeps the factors that improve it, and every model is tested on whole metro areas and later months left out of its training.
A store's score follows the conditions its staff and customers meet outside the door.
A score for the block each store is on
Neighborhood crime indexes give one number per neighborhood. The typical U.S. neighborhood they score covers about 90 CrimeGrade™ hexagons, and a quarter of them cover more than 500. A store sits on one of those hexagons, and its block can differ sharply from the neighborhood's average.
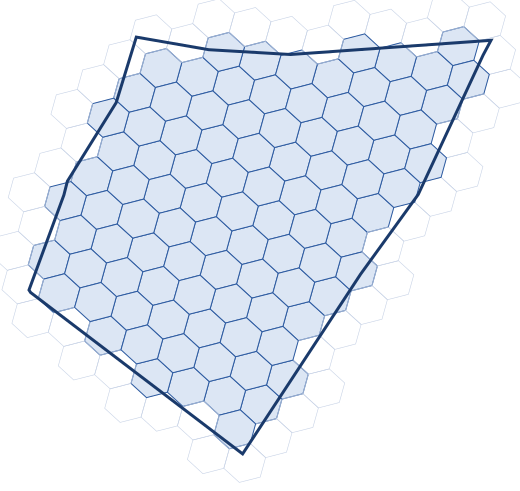
A heatmap smoothed from neighborhood totals looks detailed, but every block in it carries the neighborhood's average. CrimeGrade™ estimates crime for each hexagon, about 66 meters on a side, from the conditions on and around it. Each report gives scores at the address and in the 1-, 3- and 5-mile rings around it.
Two stores in the same neighborhood can carry different risk, and the report shows the difference.
Vehicle theft measured against the cars parked there
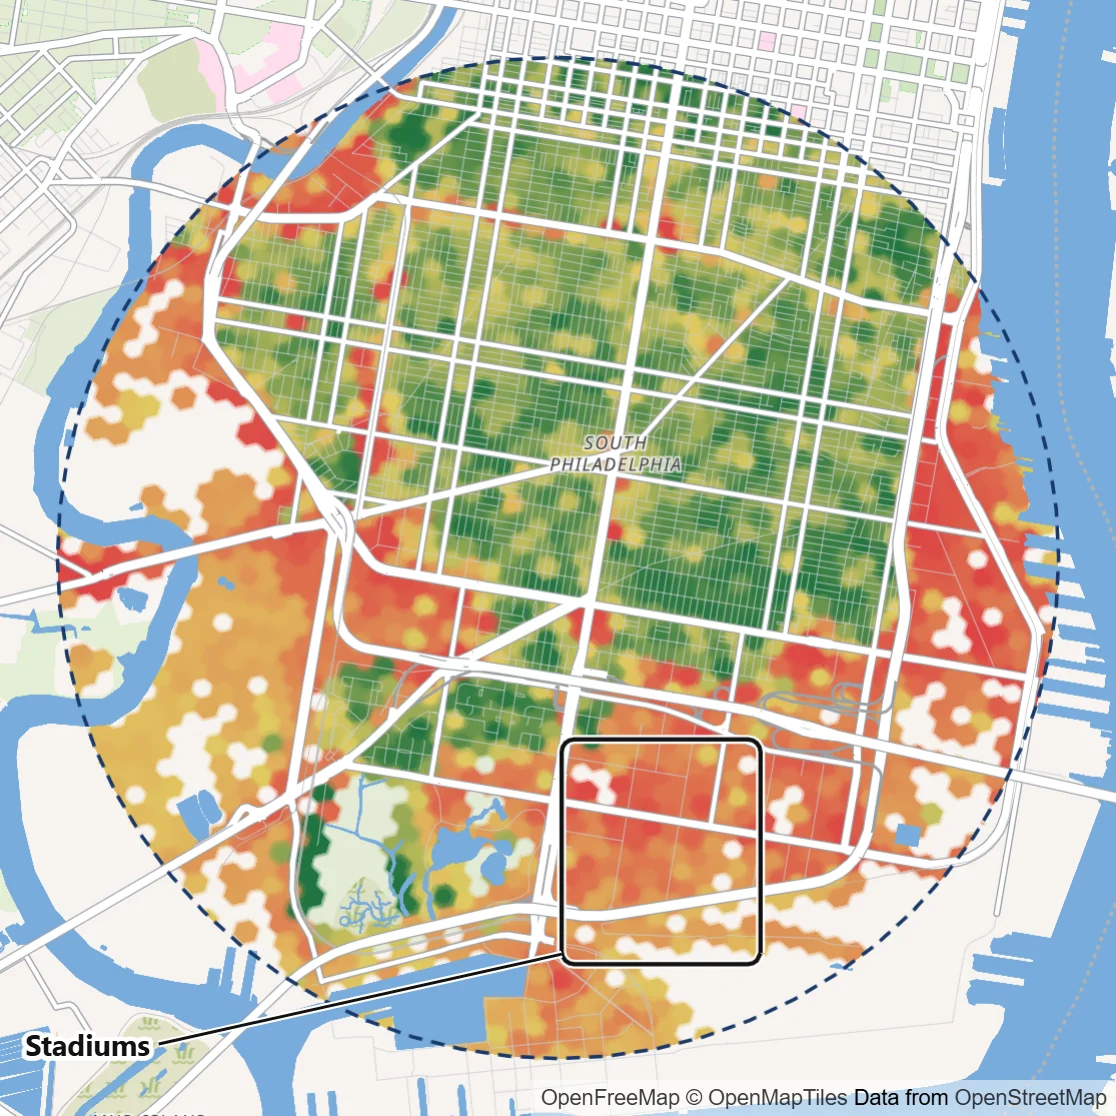
Per resident, the stadium lots look like the worst place to park
Most crime indexes divide crime by the people who live in an area. South Philadelphia's stadium complex holds tens of thousands of parking spaces and almost no residents. Divided by residents, its vehicle thefts put four in five of its hexagons in the circle's top third, while the rowhome blocks around it read as low risk.
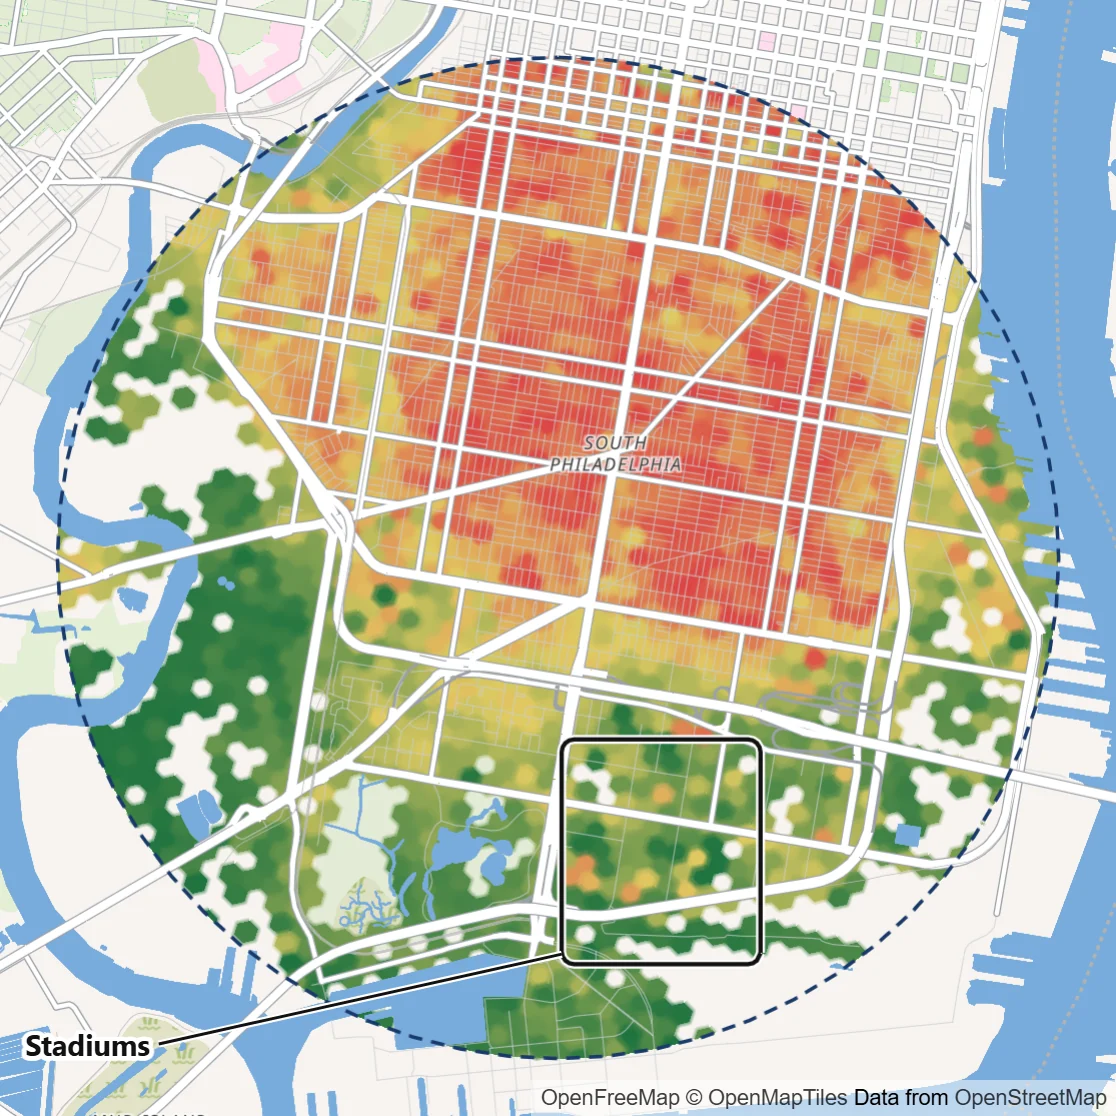
Per parking space, the risk sits on the rowhome streets
CrimeGrade™ measures each crime against what it targets, its ideal denominator. A car's risk follows the cars parked around it, so vehicle theft is measured per parking space. Measured that way, the map flips: the rowhome blocks see about 18 vehicle thefts a year for every 1,000 parking spaces, about 35 times the rate in the stadium lots.
A store's parking lot is scored on the cars parked in it, and a busy district on the people and cars that are there. See every yardstick
Police filing errors caught before they reach a score
Police departments file crime counts with the FBI month by month, and the files carry missing months, partial years, typing errors and one-month spikes. In one recent year, the thefts the Los Angeles Police Department filed with the FBI fell from about 5,500 a month to about 1,300 in May and stayed there. Its own incident records held near 5,300 a month all year. Taken as filed, those counts hold about half of the year's thefts in Los Angeles.
CrimeGrade™ checks every department's filings month by month against its own normal months. A suspect month is confirmed with independent records, such as the city's own data, and months that fail are corrected or set aside before any estimate is built.
A store's score rests on the crime its city recorded, whatever reached the FBI.
Scores even where police sent no data
About 1 in 20 Americans live where the local police department sent the FBI no crime counts for the year. In some states the share is far higher: 44% of Mississippi residents and 25% of Florida residents.
CrimeGrade™ estimates crime at every address with the same model it uses everywhere. In states that keep their own crime records, such as Florida and New York, the estimates are checked against the state's counts.
A chain can compare every location on one scale, whatever the local department filed.
Where crime happens, and where it comes from
Where crime happens
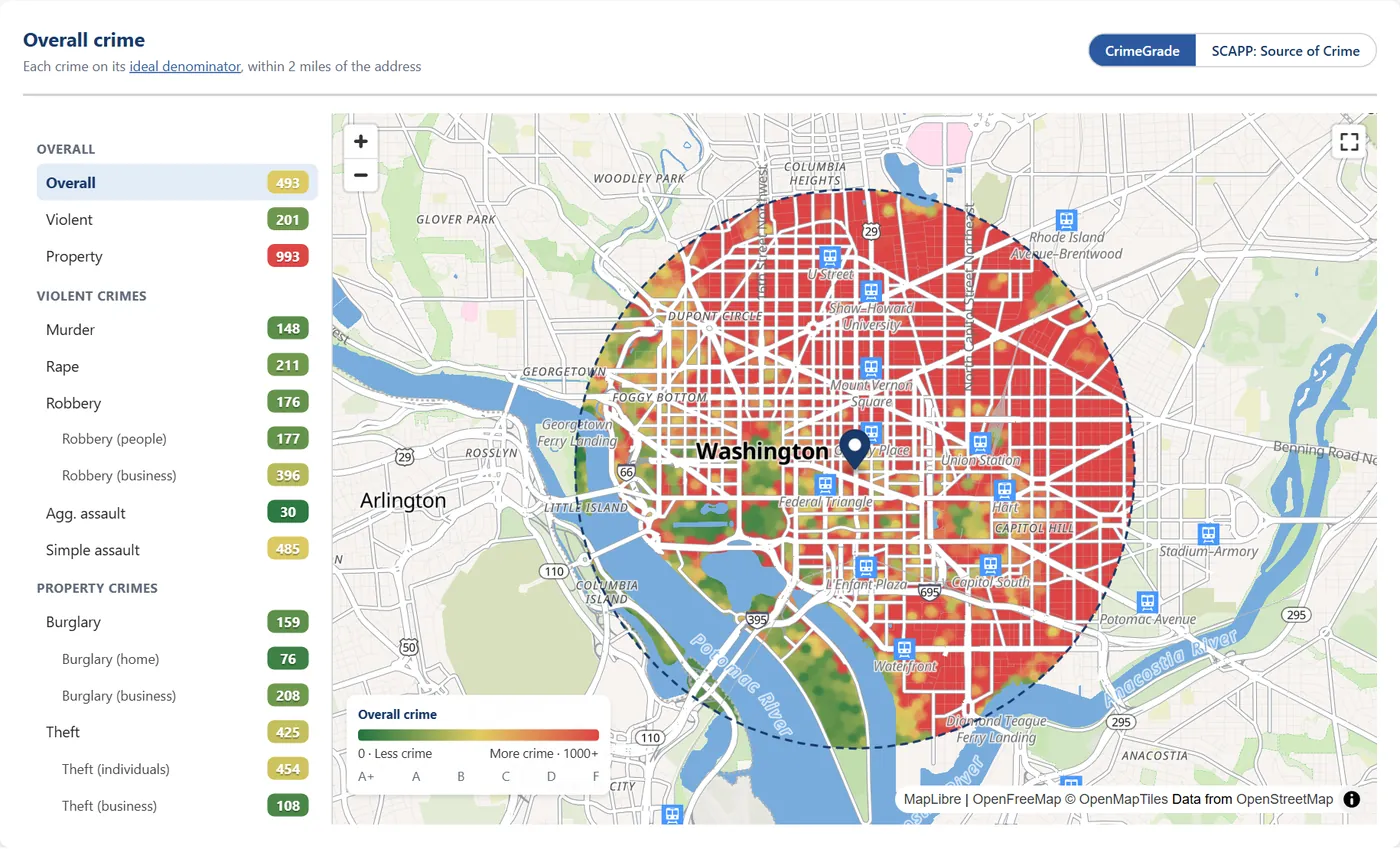
Each report gives CrimeGrade™ scores for each crime at the address and in the 1-, 3- and 5-mile rings, on one national 0 to 1000 scale, with a map of each crime hexagon by hexagon. CrimeGrade™ store scores compare the location with the typical store of its type, where 100 is typical.
Where it comes from
SCAPP: Source of crime against property and people is the CrimeGrade™ estimate of where people likely to commit crimes live, on the familiar scale where 100 is the U.S. average. Every report includes SCAPP site scores at 1, 3, 5, 6, 10 and 12 miles, so risk models built on legacy source-of-crime reports keep working.
Download example report (PDF, 36 pages, 9.2 MB)
Teams keep the benchmarks they use today, and each store is scored where crime happens.
Questions from business buyers
How is this different from a neighborhood crime index?
A neighborhood index gives one number for an area and divides crime by residents. CrimeGrade™ scores the hexagon at the address, about 66 meters on a side, measures each crime against what it targets, and compares a business with the typical store of its type.
What does a report cover?
Any U.S. address and the 1-, 3- and 5-mile rings around it. Crime counts come from police incident records and FBI crime statistics, and every figure counts crimes reported to police. Definitions for every figure are on the Data definitions page.
What is SCAPP?
SCAPP: Source of crime against property and people is the CrimeGrade™ estimate of where people likely to commit crimes live, on the familiar scale where 100 is the U.S. average, with site scores from 1 to 12 miles. SCAPP is built by CrimeGrade™ and is not affiliated with any other provider.
Why not crimes per resident?
Residents are the right yardstick for a few crimes, such as home burglary. For most crimes against a business, the people and cars present matter more. A shopping district with few residents and thousands of shoppers reads as dangerous per resident, while each shopper's risk can be low.
How current is the data?
CrimeGrade™ updates its data once a year, and each report names the release it was built on. The current release is the 2026 Winter Update.
What happens where police filed no data?
CrimeGrade™ estimates crime there with the same model it uses everywhere, so every address gets a score.
Are exports, portfolio scoring and custom models available?
Every report exports to CSV, with full scores for modeling. Portfolio scoring, an API and custom models built on your own loss data are available through the enterprise tier.
How is customer data handled?
Each organization's locations and reports are private to it, and address-level detail appears only for the locations it buys. CrimeGrade™ deletes an organization's data within 30 days of a request. The Security page has the details.