
Crime risk for every business location, precise to the block
CrimeGrade™ scores each crime at the address and compares each location with the typical store of its type. Every site lands on one national scale, so security budgets, staffing and site choices can follow the risk.
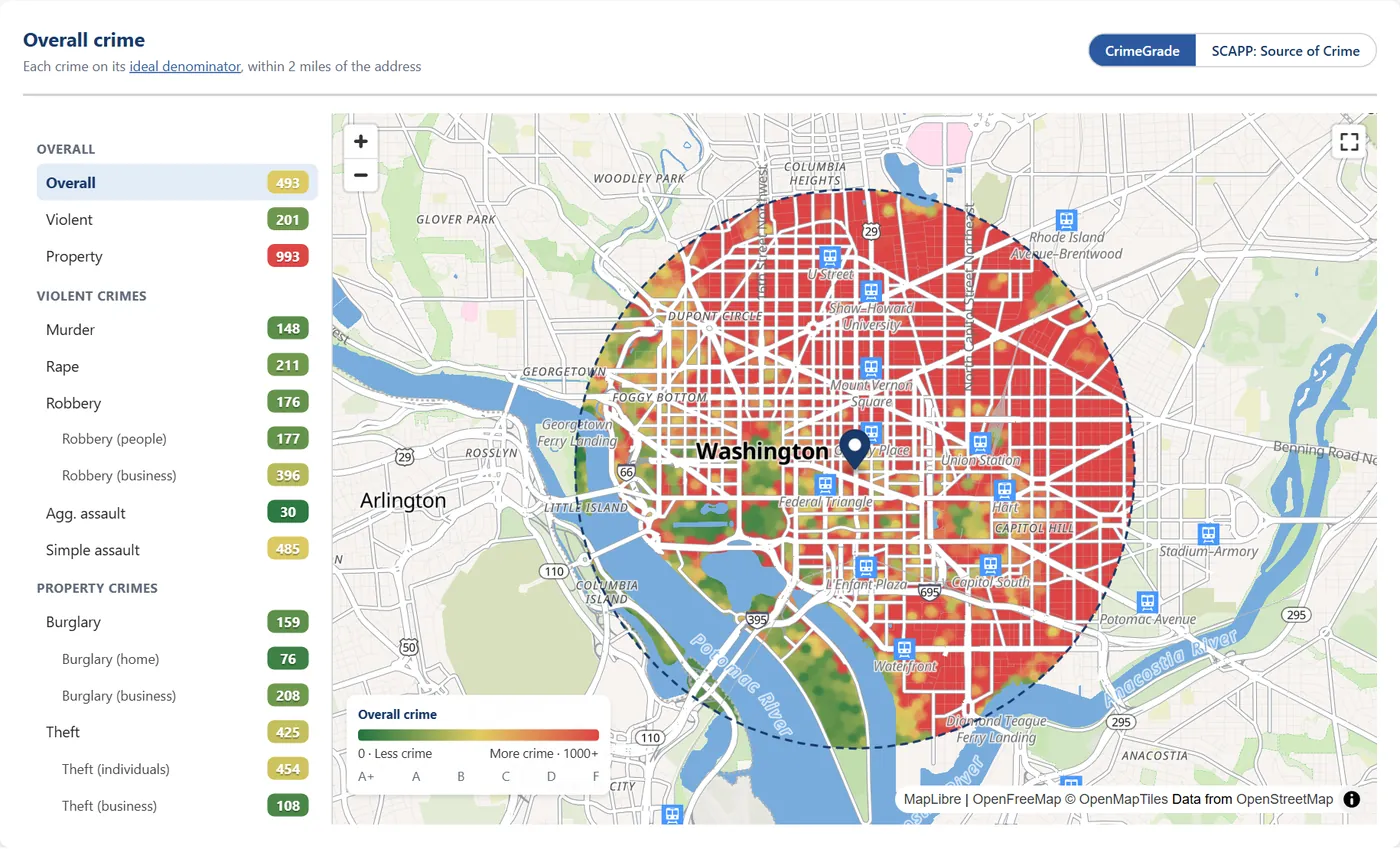
Each store compared with the typical store of its type
A pharmacy and a bar on the same block face different risks. A CrimeGrade™ store score compares each location with the typical store of its own type, crime by crime. A score of 100 matches the typical store of that type nationwide, and 200 means about twice its incidents. Chain stores are compared with chains, and independent stores with independents.
The weighted store score combines the crimes by each crime's share of a typical store's crime losses. Shoplifting weighs most at retail stores, assault at bars, hospitals, fast-food restaurants and hotels, and burglary at most other businesses.
Guard hours, fixtures and audits can follow the risk for each kind of store at each address.
The CrimeGrade™ store score
Scores that hold up in downtowns and shopping districts
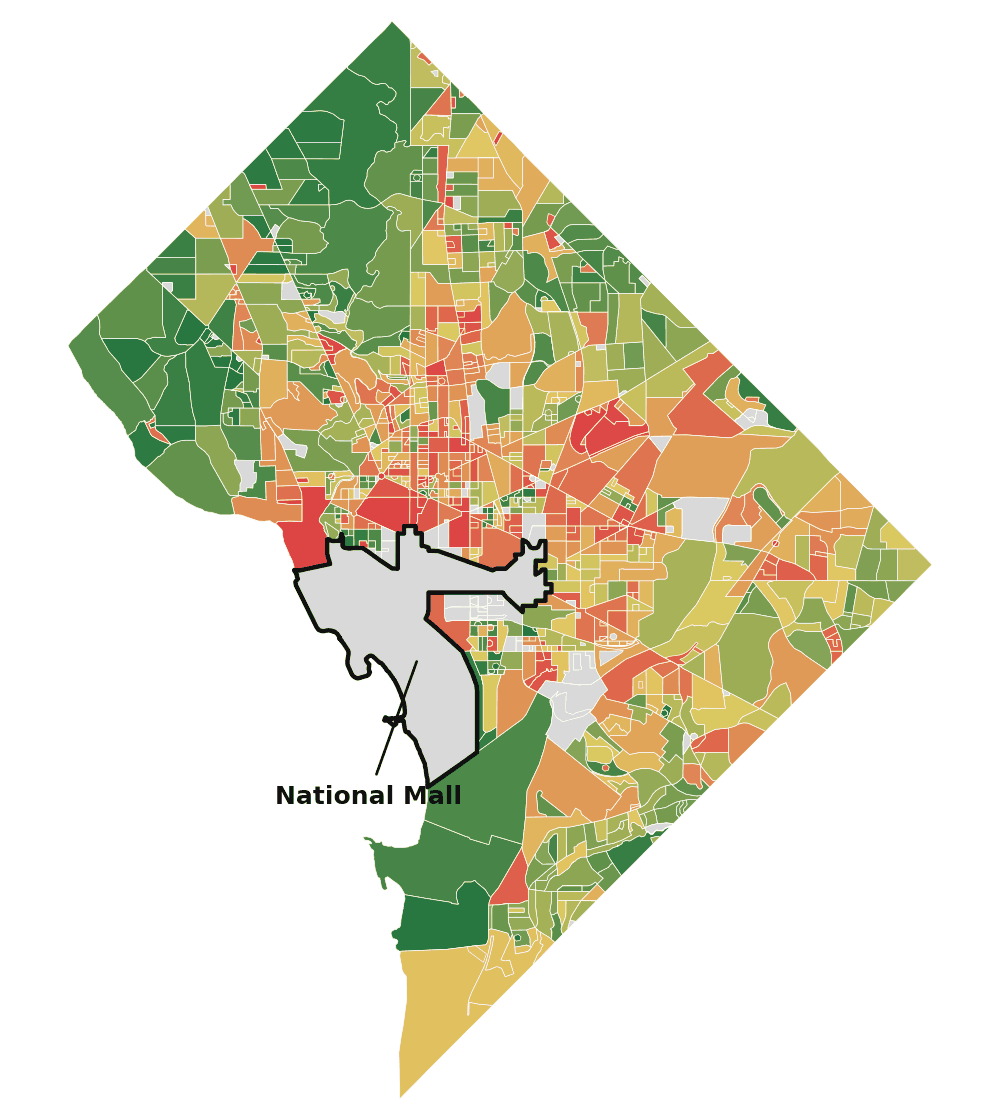
Most crime indexes divide crime by the people who live in an area and give one number for each neighborhood. Downtowns, parks and shopping districts have few residents and many visitors, so per-resident rates make them look like the most dangerous ground in a city. Many stores operate in exactly those places.
CrimeGrade™ scores every hexagon about 66 meters on a side and measures each crime against what it targets: shoplifting against retail floor space, vehicle theft against parked cars and street robbery against the time people spend in public.
Theft per resident, by neighborhood
CrimeGrade™ theft score, by hexagon
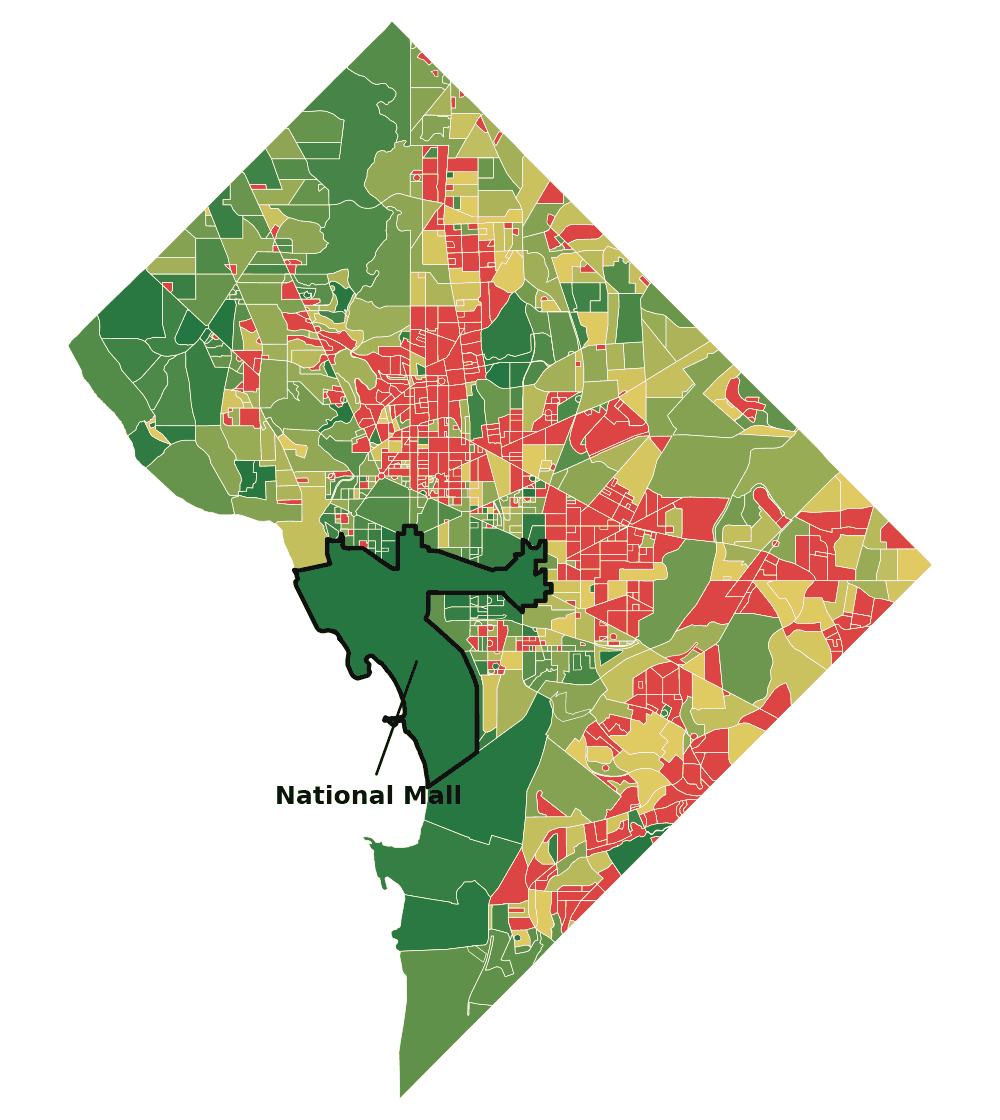
A store in a busy district is scored on the risk to the shoppers, workers and cars around it, which is the risk the store carries. What makes the scores accurate
Keep existing risk models running through a switch
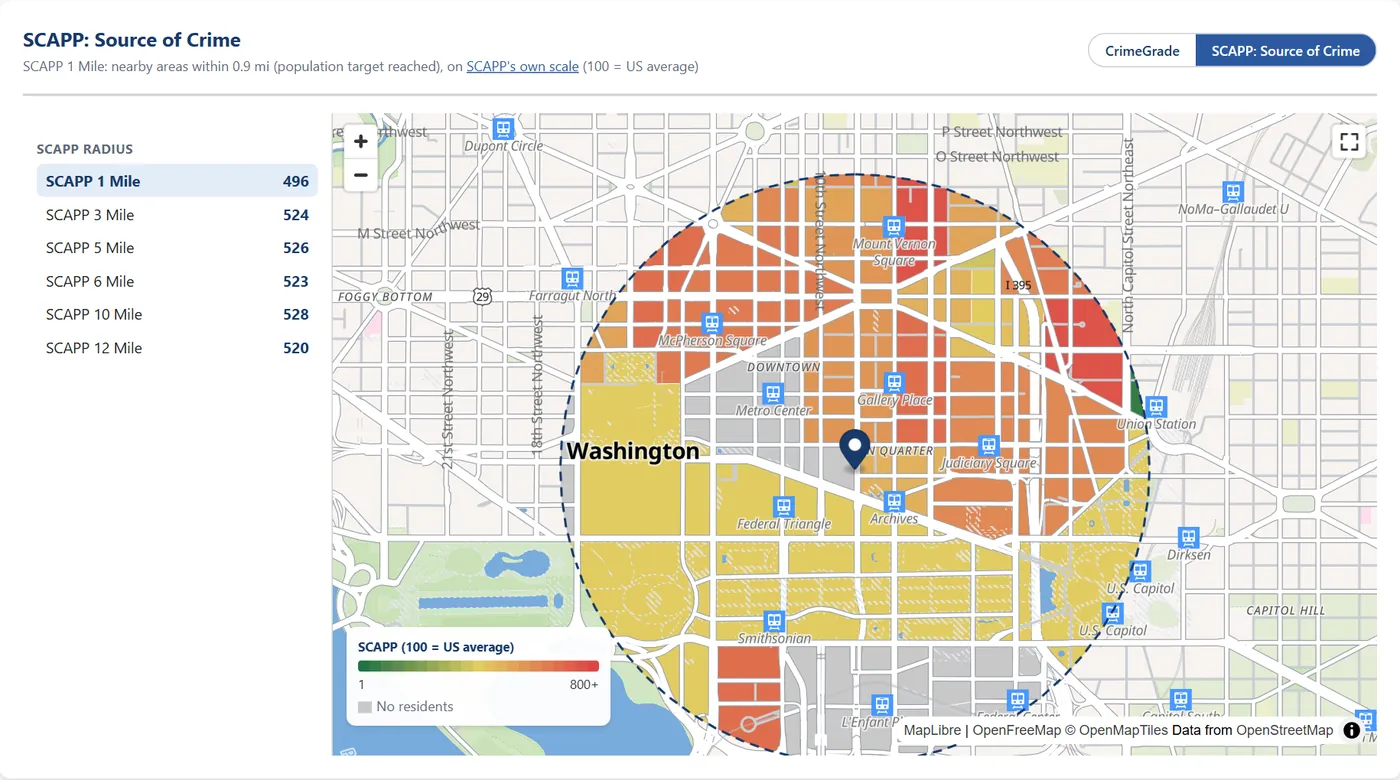
Many security teams run risk models built on legacy source-of-crime reports, which estimate where people likely to commit crimes live. SCAPP: Source of Crime is the CrimeGrade™ estimate on that familiar scale, with 100 as the U.S. average, so those models keep working after a switch.
- Site scores at radii from 1 to 12 miles, labeled SCAPP 1 Mile, SCAPP 3 Mile and so on
- Every field in a CSV export, with full scores for modeling
- CrimeGrade™ scores for where crime happens, in the same report
Source-of-crime scores describe where offenders may live. A store's losses happen where crime happens, and that is what CrimeGrade™ scores measure.
Teams can move to CrimeGrade™ without rebuilding the models they rely on today.
The decisions CrimeGrade™ supports
Protect the stores that carry the risk
Compare locations by the crimes that cost each type of store the most, then set guard hours, fixtures and audits to match.
Check a site before signing the lease
Score a planned address and its 1-, 3- and 5-mile rings, with written advice for new stores.
Size guard and patrol coverage
Yearly crime counts in each ring show the volume a patrol or guard plan has to cover.
Review commercial exposure
Score commercial properties and whole portfolios at the address and in the area around it.
Pricing
Launch special
From $149 a location for 20 or more reports in an order.
Organizations that order while launch pricing is offered keep launch prices for two years.
Enterprise
100+ locations: custom modeling on your own loss data, and discounts when switching from another provider.
Enterprise