
What makes CrimeGrade™ scores accurate
Three things make CrimeGrade™ scores hold up at a business address. Every crime is measured against what it targets. Every estimate is made block by block. Every model is tested on places and months it never saw.
The right yardstick
Shoplifting is measured against retail floor space, vehicle theft against parked cars and street robbery against the time people spend in public.
See the differenceEstimated block by block
CrimeGrade™ estimates crime for each hexagon about 66 meters on a side. A heatmap smoothed from neighborhood totals gives every block the same average.
See one neighborhoodTested on what it never saw
Each crime's model is judged on whole metro areas and later months left out of its training, the same test a new market puts it to.
How the models are testedThe denominator decides which places look dangerous
A crime rate divides a count of crimes by a denominator: the people who live in an area, the hours people spend there or the cars parked in it. Divide by residents, and any place where many people spend time but few sleep reads as dangerous. A park with 10 crimes a year and 2 residents ranks among the most dangerous places in the country per resident. Measured against the thousands of hours visitors spend there, the same 10 crimes describe a safe park. The Las Vegas Strip shows the same effect on a much larger stage.
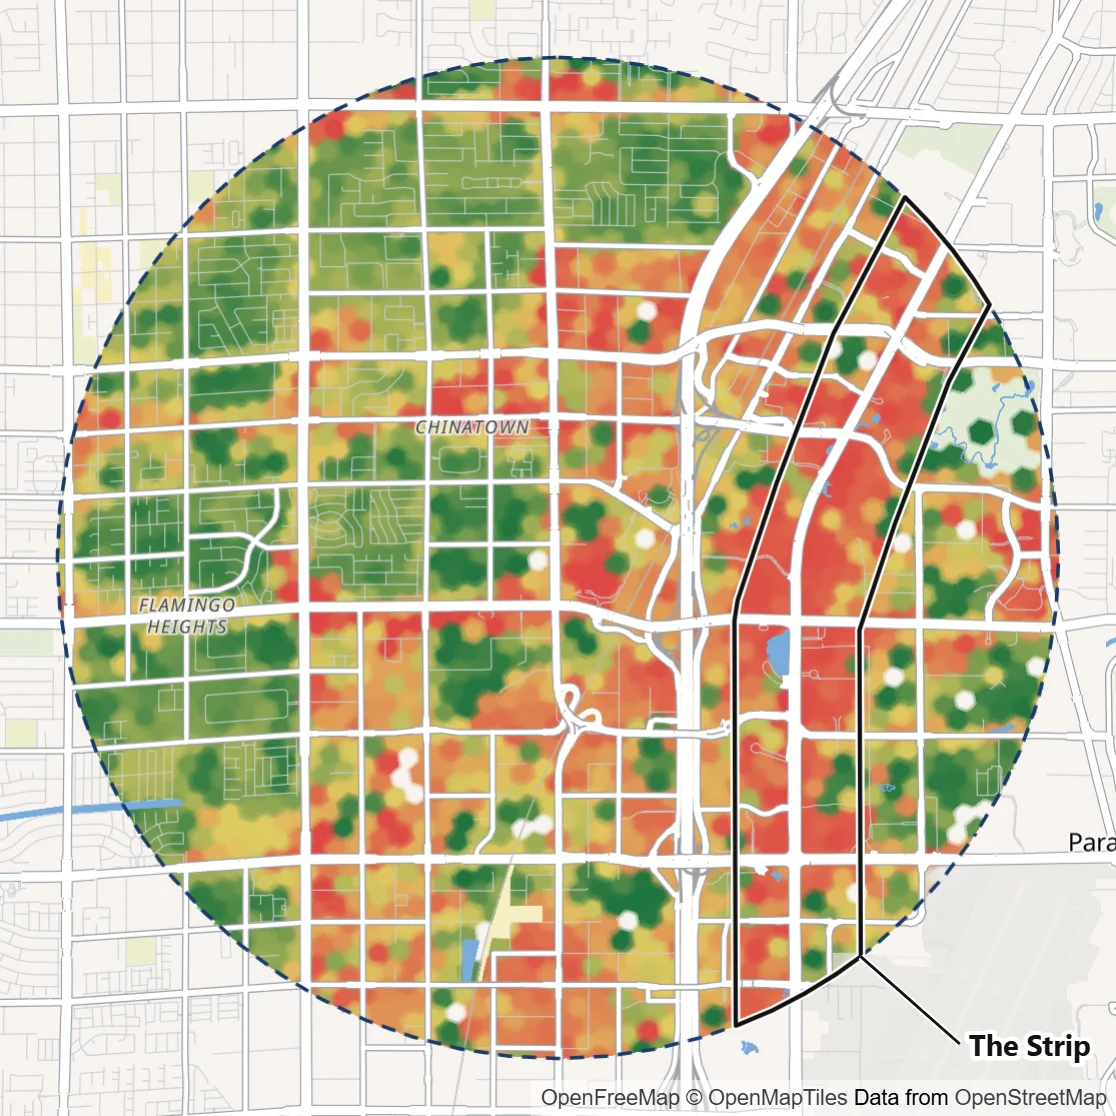
Per resident, the Strip looks like the robbery capital of Las Vegas
About 500 people live along the Strip, and it records about 6 in 10 of the robberies in this circle. Divided by residents, its robbery rate runs more than 100 times that of the neighborhoods around it. Ranked that way, the casino blocks look like the riskiest ground in the circle, which matches the Strip's reputation.
Per hour people spend there, the Strip's crowds share the risk
The Strip holds nearly two thirds of the hours people spend in public in this circle, walking between casinos, shops and shows. Spread over all those hours, four in five of its hexagons rank in the circle's lowest third for robbery. A few hexagons carry most of its robberies, and taken as a whole the Strip's rate per hour matches the off-Strip shopping centers. The residential streets nearby run more than four times higher, because far fewer people are out on them.
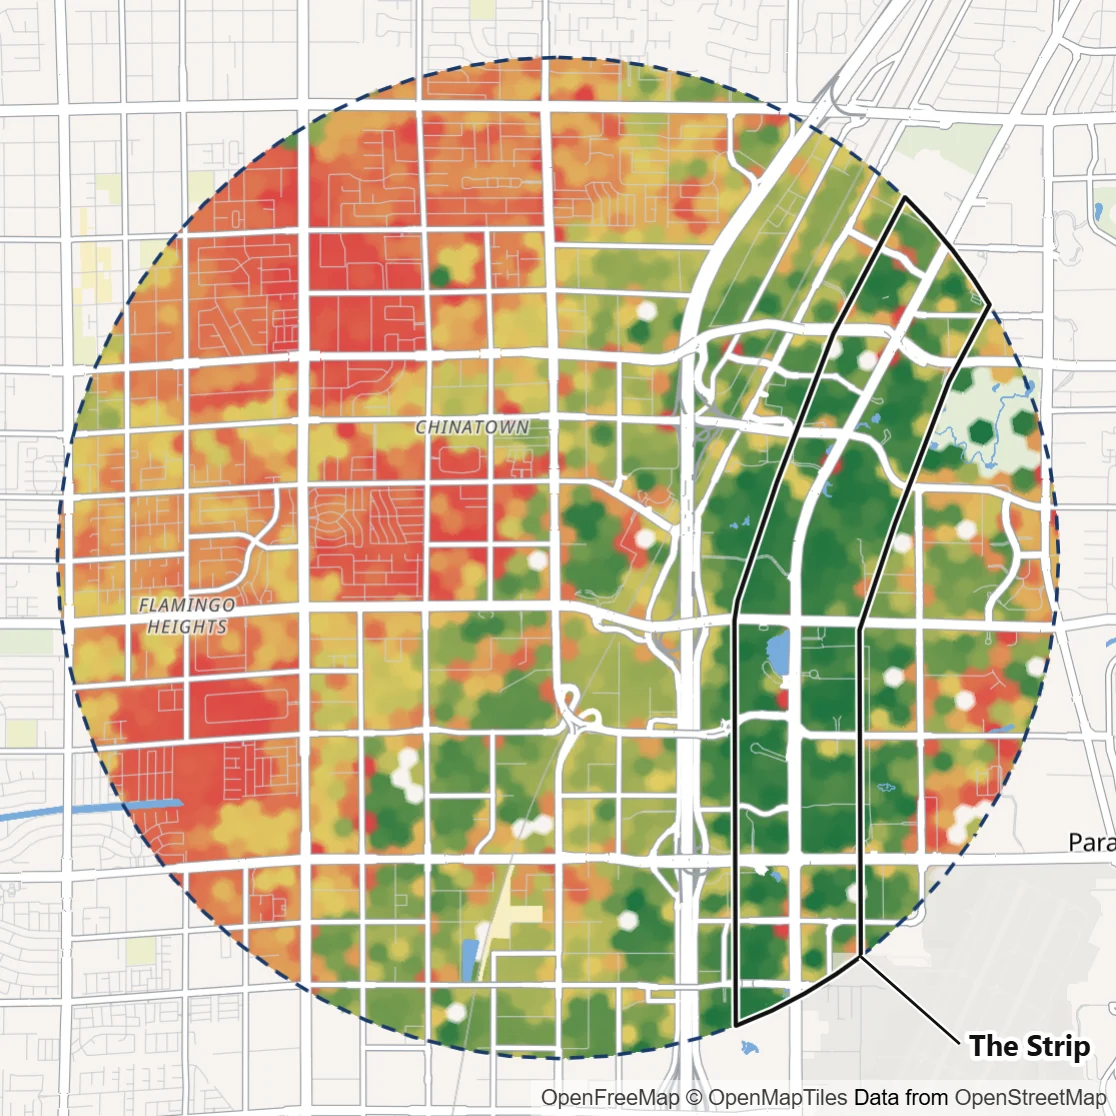
A store is scored on the risk to each person around it, so crowded blocks and quiet streets compare fairly.
Each crime's yardstick, mapped
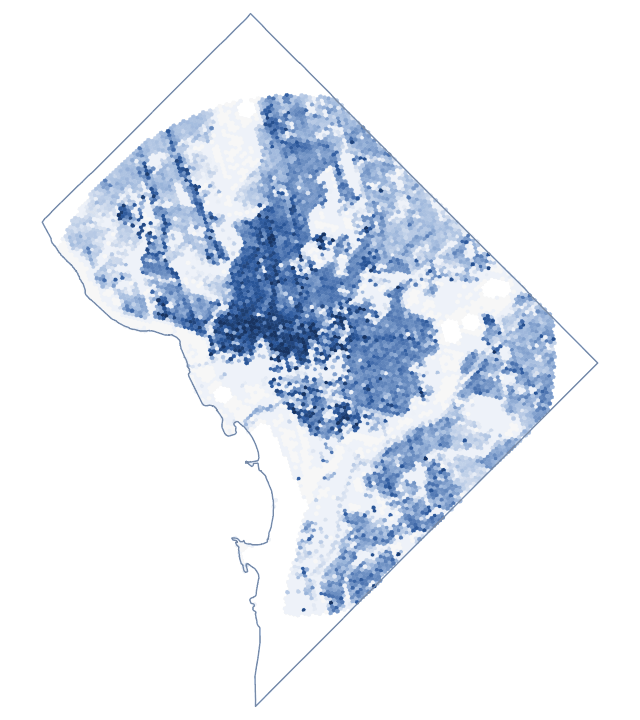
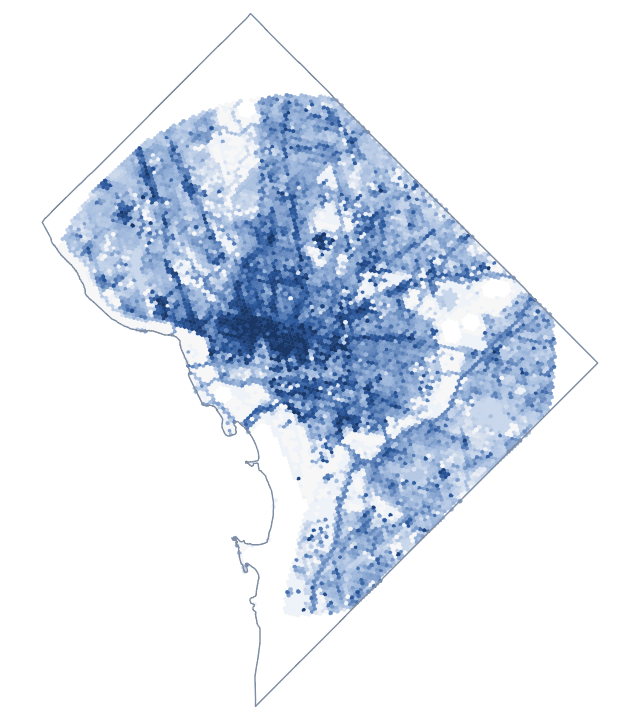
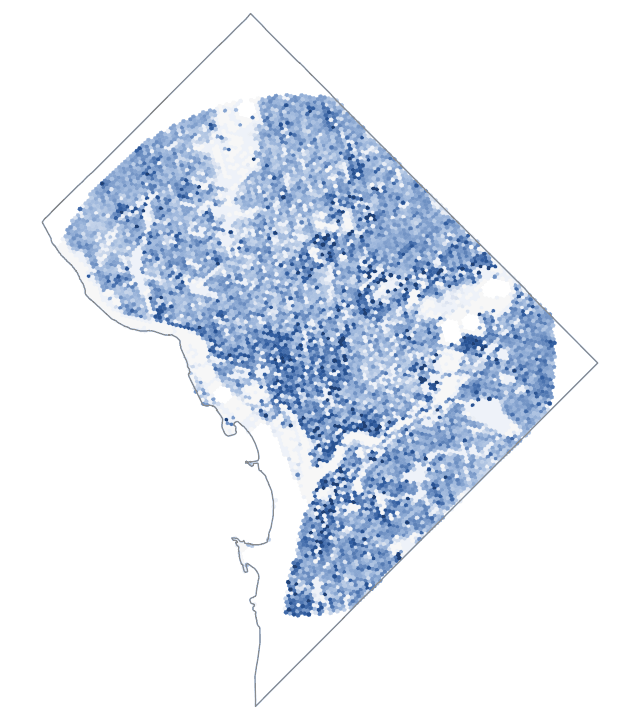
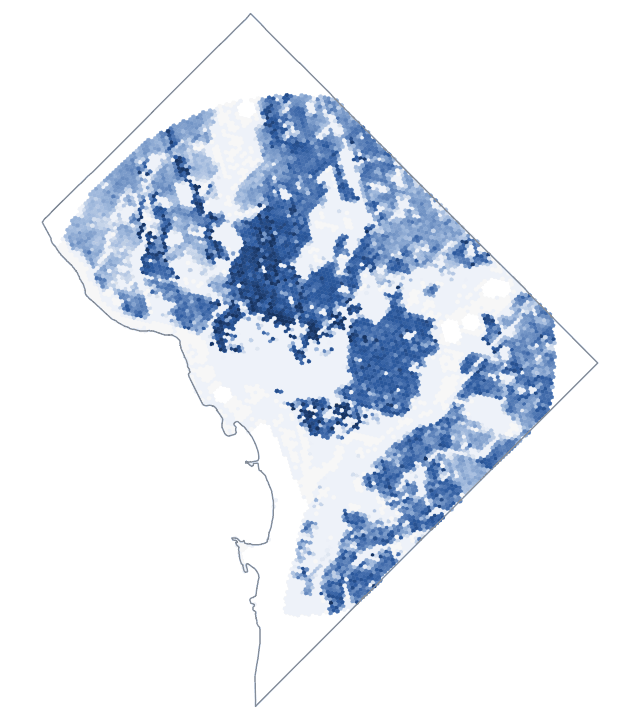
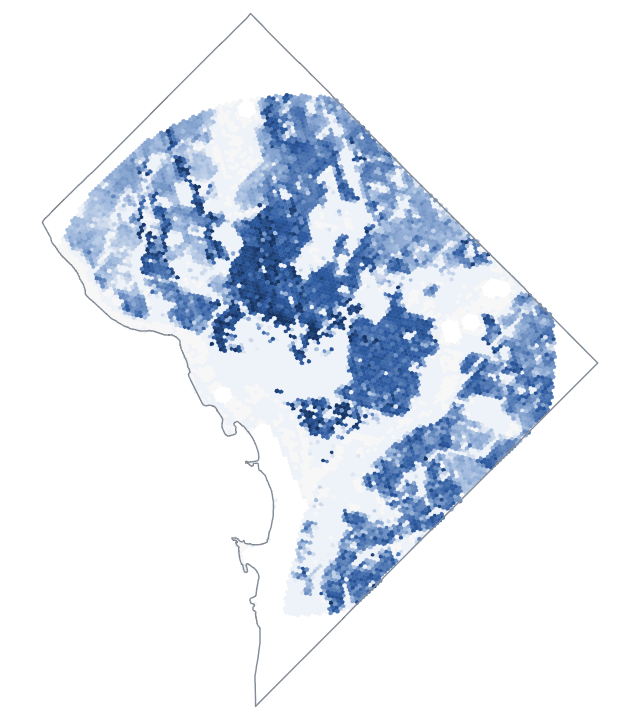
CrimeGrade™ divides each crime by what that crime targets, which it calls the crime's ideal denominator. Each map shows one yardstick across Washington, DC on the hexagon grid, from fewer (light blue) to more (dark blue). CrimeGrade™ builds the same layers for every hexagon in the country.
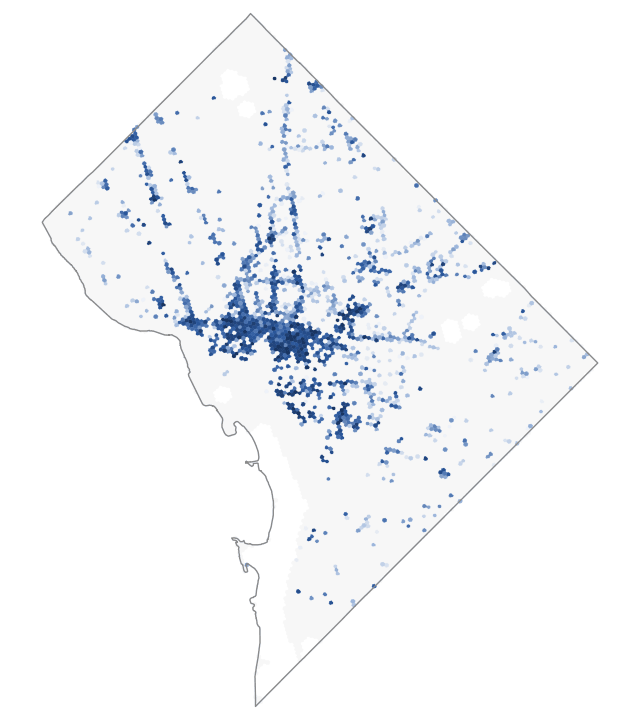
Retail floor area
Shoplifting follows the size of the sales floor, so it is measured per 1,000 square feet of retail floor area. Theft from businesses is measured the same way against all commercial floor area.
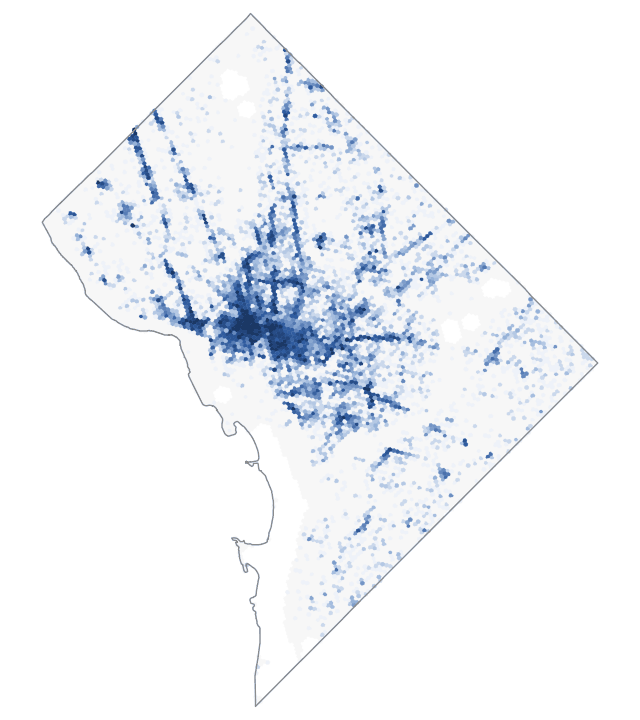
Businesses
Each business is a target, so robbery of a business is measured per 100 businesses. Burglary and arson of businesses are counted per 100 businesses too, and their scores use the household and housing-unit measures, like all burglary and arson.
Person-hours
The hours people spend in a place, at home, at work or out in public. Violent crime follows people, so its rate follows where people are, around the clock.
Estimated hour by hour for every hexagon, from where people live, work, shop, study and visit.
Public person-hours
The hours people spend outside their homes: on the street, at work, in stores and in parks. Street robbery happens in public, so time at home is left out.
Open parking spaces
The risk to a car follows the cars parked around it. CrimeGrade™ counts about 1.5 billion parking spaces nationwide in six classes: street, lot, driveway, home garage, public garage and airport. Vehicle theft is measured against the open ones, everything except home garages.
Theft from vehicles is measured per 1,000 parking spaces.
Households
Occupied homes. Most burglaries target homes, so burglary is measured per household.
Housing units
Homes, occupied or empty. Arson strikes buildings whether or not anyone lives in them, so the yardstick counts every home.
Housing units and businesses
Vandalism strikes homes and businesses alike, so its yardstick counts both.
Public person-hours and parking spaces
Theft takes from people and from cars, so its yardstick blends the two, about 64% people and 36% vehicles nationally.
Each block scored on its own
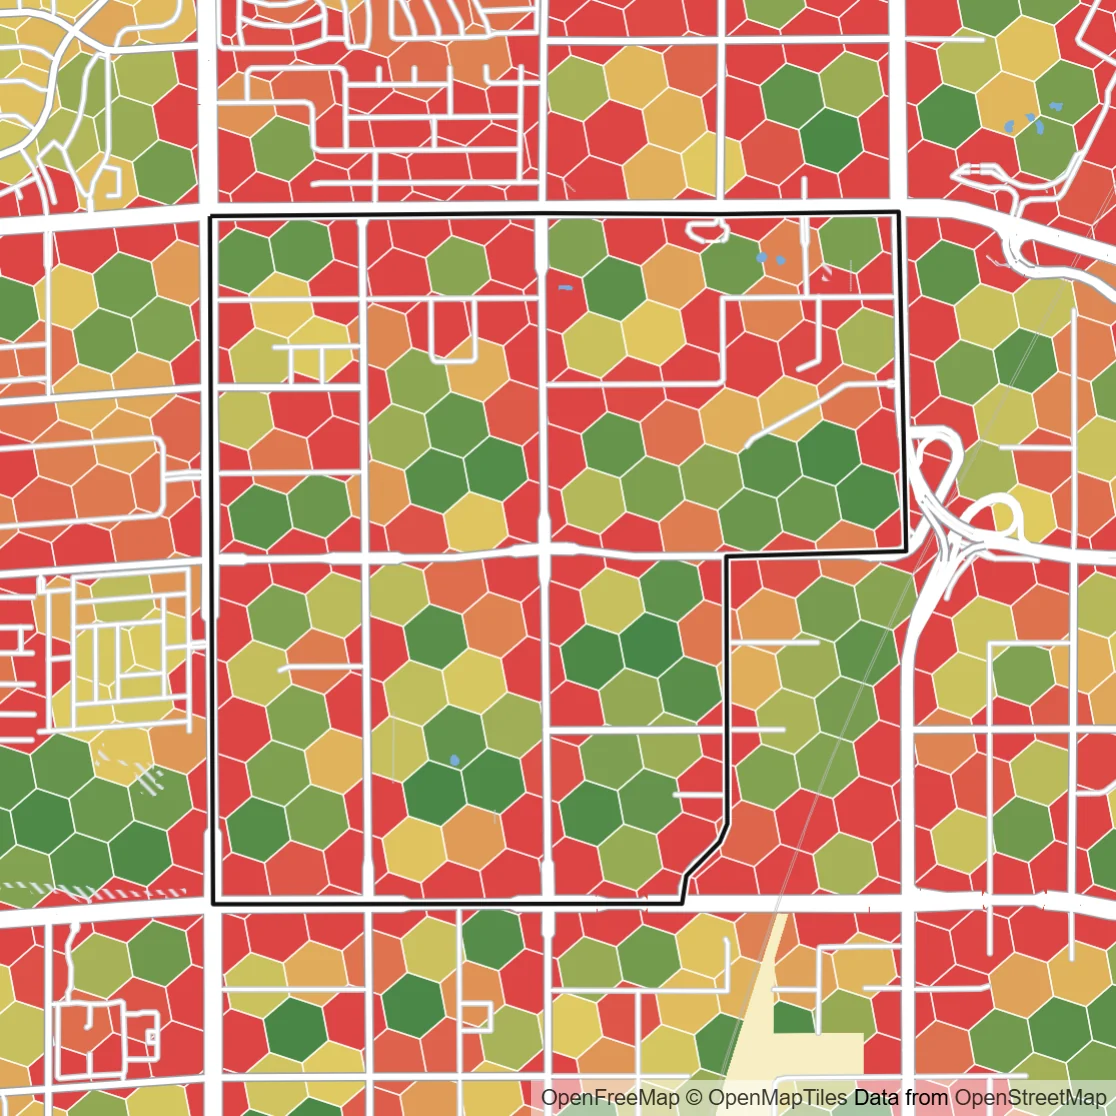
A neighborhood crime index gives every block in a neighborhood the same number. CrimeGrade™ estimates crime for each hexagon about 66 meters on a side, from the conditions on and around it, so stores a block apart get their own scores.
The neighborhood outlined on the map, west of the Las Vegas Strip, holds 132 hexagons. Their overall CrimeGrade™ scores run from about 100 to 1000 and up. The hexagons along the busy roads at its edges score highest, and its inner blocks score lower.
A store's score describes its own block, so two stores in one neighborhood can carry very different risk.
Tested on places and months it never saw
Each crime's model learns from police records across the country. To show how well it predicts crime somewhere new, CrimeGrade™ scores each model on whole metro areas and later months that were left out of its training. Each model keeps only the factors that improve it.
The police counts behind the models are checked first. Every report names the release it was built on, and CrimeGrade™ updates its data once a year.
The scores a team acts on have been tested on ground the models never trained on.
Which number answers which question
Yearly counts in the rings
How much crime the 1-, 3- and 5-mile rings hold in a year. Counts size patrols and guard coverage.
CrimeGrade™ scores for each crime
Each crime on its ideal denominator, on one national 0 to 1000 scale. A score means the same level of risk in a city center and a rural county.
CrimeGrade™ store scores
A business compared with the typical store of its type, where 100 is typical and 200 about twice the incidents.
Every crime and its denominator
The full list, with each denominator's unit, is on the Data definitions page.
| Crime | Denominator | Why it fits |
|---|---|---|
| Shoplifting | Retail floor area | Shoplifting follows the size of the sales floor |
| Theft from businesses | Commercial floor area | Theft follows the size of the business |
| Robbery of businesses | Businesses | Each business is a target |
| Robbery of people | Public person-hours | Street robbery happens away from home |
| Murder, rape and sexual assault, aggravated and simple assault | Person-hours | Violence follows where people are, at any hour |
| Burglary | Households | Most burglaries target homes |
| Theft | Public person-hours and parking spaces | Theft takes from people and from cars |
| Vehicle theft | Open parking spaces | The risk to a car follows the cars parked nearby |
| Arson | Housing units | Counts the homes at risk, occupied or empty |
| Vandalism | Housing units and businesses | Vandalism hits homes and businesses alike |