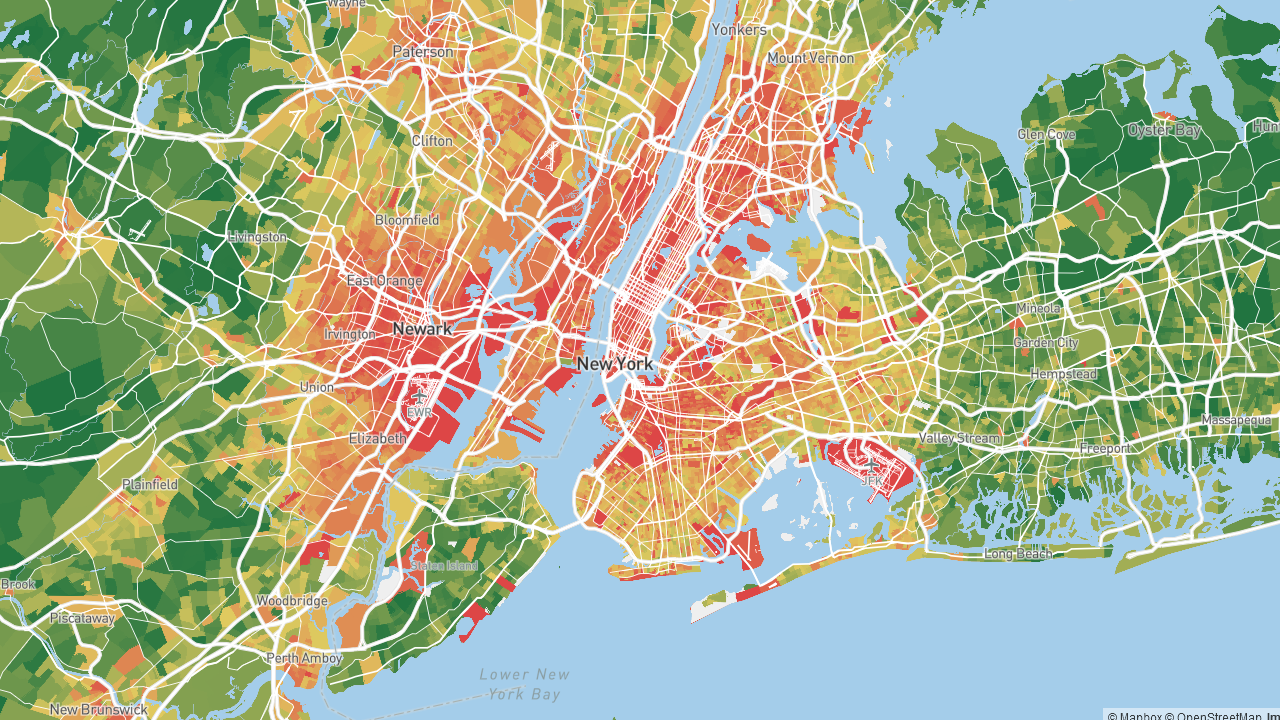
This report mirrors what is shown for free on CrimeGrade.org. The difference is that this map is weighted towards your selected business impact weight. This map is interactive across the nation, and free to anyone who buys a location report. Note that this data is only available in cities with a significant number of retail establishments, but you can zoom out for county-level data.
Weighted Crime Grades
73.2 (B+)
Address Crime Grade™
This grade is a relatively objective measure of how much crime one can expect, weighted by the importance you or your organization selected. The percentile (aka score) is based on how much profit-impacting crimes are expected at this address and in the immediate area. I.e. the grade should reflect the shade on the map above.
The default weight for non-storefront retail and commercial is as follows:
- 50% burglay
- 20% theft
- 15% vandalism
- 10% robbery
- 5% vehicle theft
These pages use the default weight listed above.
The default for retail locations that are storefronts, where most losses are due to shoplifting, are as follows:
- 60% theft
- 15% robbery
- 10% burglary
- 10% vandalism
- 5% vehicle theft
Custom weights are available through sales. For example, if your organization knows it loses 9 times more through theft than through robbery, CrimeGrade can create a weight of 90% theft and 10% robbery. We can also assist you in weight census data, some of which can be seen on Best Neighborhood. For example:
- Household income in a 3-mile radius
- Median age above 50 in a 5-mile radius
- Median home value divided by number of bedrooms
- Other customer data or data to be purchased – some charges may apply