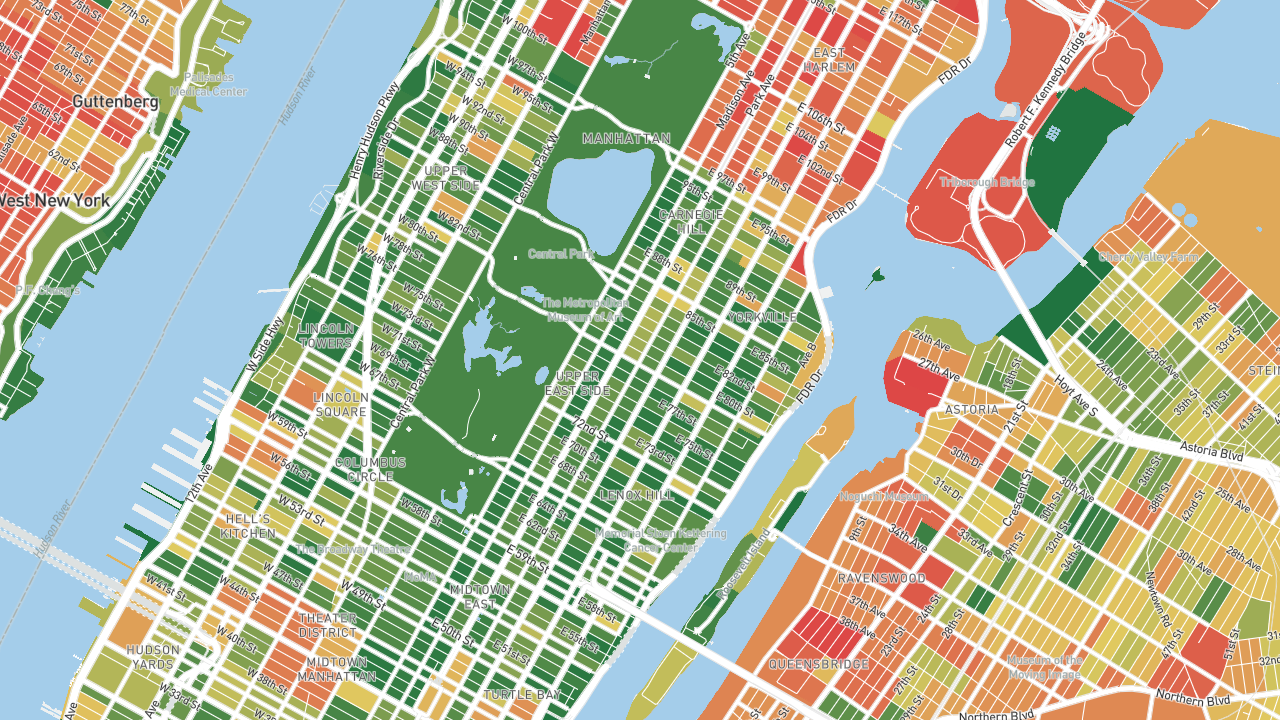
The map below shows the neighborhoods where crime is most likely to originate from. The model for this map is much simpler than Crime Grade's other maps, and generally not recommended as the primary source for decisions because they do not attempt to show where crime occurs. To most business owners and homeowners, it is not relevant where potential criminals live if they are victims of crime. Why do we include it? The simple model is what most of our competitors use. Lacking better data, some companies in delivery and insurance have found ways to adapt and extrapolate based on our competitors' simpler models. We provide these figures and maps so these businesses can use their legacy processes with minimal adaptation while developing new processes based on where crime actually happens. There are fringe cases where it may be useful as well, such as when a business is considering moving into an undeveloped or purely residential area where crime clusters (most often retail and commercial areas) have yet to form. Data is shown as an absolute value (e.g. raw number of likely criminals) and not per capita.
Name:
Example Store Name on 79th St and 3rd Ave
Address:
E 79th St & 3rd Ave
New York, NY 10075
Source Crime Grades
73.2 (B+)
Source Crime Grade™
Source Crime Grade™ is based on our model of where those committing crimes are likely to live and the distance from their homes. In general criminals do not travel very far from their homes. For example, a majority of most crimes are committed within 1 mile of the perpetrators home. As explained on this page, this simplistic model does have its limits. For example, it may not take into account more tempting high-value targets, nor can it account for tourists in unknown numbers with unknown backgrounds. This is why our other maps use far more complex and precise methods to show where crime actually happens.